ESL Assessment Tasks
Assessment tasks by Shamira Macoto
Sunday, May 17, 2015
Pie Graph
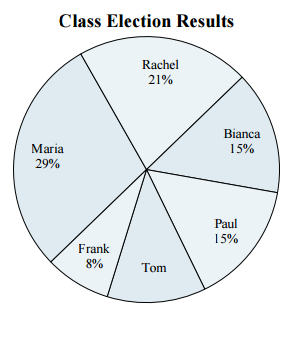
Direction: Refer to the Pie Chart regarding class election results. Answer the following questions below.
Class Election Results
1) Who won the election?
2) Who got the least number of votes?
3) What percent of people voted for Tom?
4) What percent of people voted for either Paul or Frank?
5) Which two candidates had about half the votes?
No comments:
Post a Comment
Newer Post
Older Post
Home
Subscribe to:
Post Comments (Atom)
No comments:
Post a Comment